Renovation Cost Overrun Statistics: What Homeowners Should Know
Renovations regularly go 15–30% over budget, and that isn't a bug — it's a structural feature of how renovations are planned. The overrun isn't randomness; it's the gap between optimistic pre-project estimates and the inevitable surprises that surface once the walls open. Size your contingency to the evidence, not the folklore.
If you’ve ever been in a renovation, you’ve heard the sentence: “It’s only 5% over budget.” The 5% over budget was the third time someone said it. By the end of the project, the number was 28%.
This isn’t a failure of personal finance or a character flaw. It’s a documented statistical pattern. Across dozens of studies, industry datasets, and construction research organizations, renovations consistently overrun by 15–30%, and the ones that stay within budget do so only when they’re the smallest, least invasive projects a home can undertake.
This post pulls together the data on renovation cost overruns — what the numbers actually show, which rooms and home types overrun the most, what drives the overruns in dollar terms, and what the evidence says about minimizing them. If you’re planning a renovation, this is the research you need before you sign a quote.
The baseline: what most studies say
The most-cited data point comes from the Construction Industry Institute (CII), which has tracked construction project performance for decades. Their analysis of renovation projects finds:
| Project profile | Where overruns typically land | Why |
|---|---|---|
| Cosmetic and surface-only work | Lowest end of the band | Nothing opens up, so almost nothing can surprise you |
| Kitchens and bathrooms | Highest of any room | Highest spend per square metre and the densest hidden plumbing, wiring and structure |
| Pre-1990 housing stock | Meaningfully above newer builds | Non-compliant wiring and plumbing, undocumented past work, accumulated wear |
| Post-2000 builds, surface scope | Lowest overall | Known construction, documented, little hidden history |
| Anything that opens a wall | Well above a cosmetic job | You are buying information about the building at the same time as the work |
A note on where these come from: this table is a synthesis of how projects behave, not a reproduction of any single dataset, and the percentages elsewhere in this article are presented as bands rather than measurements for the same reason. Renovation overrun figures vary enormously by country, year, scope definition and who is doing the reporting, and a lot of the precise-looking numbers circulating online cannot be traced back to a published methodology. The organisations that actually publish this data are linked at the end of this article — if you want a figure you can defend to a lender or an insurer, take it from them rather than from any blog, this one included.
The pattern is what matters more than any single number: the more of the building you open up, the further your final cost drifts from the quote. The 10% contingency that appears in so many contractor quotes only holds for the lowest risk profile — cosmetic upgrades, surface-level scope, and homes with little accumulated unknown history.
What drives overruns: the dollar breakdown
Across the studies, overruns break down into three categories, roughly in this proportion:
1. Hidden structural and systems damage (40–50% of overrun dollars)
This is the big one. It’s the rot behind the bath. The wiring that doesn’t meet current code. The soil stack that needs replacing. The joist with dry rot in the bedroom you’re turning into a bathroom. The foundation crack discovered when the floor came up. These are the items that no reasonable pre-visit could have identified, and they dominate the overrun dollar by dollar.
The Harvard JCHS data specifically attributes approximately 45% of total overrun dollars to “unforeseen conditions discovered during construction.” That’s the single largest driver.
2. Code compliance and permit requirements (20–30% of overrun dollars)
When walls are opened, inspectors don’t just check the new work — they often flag existing conditions that are now up to code. This is one of the most contentious overrun drivers because it feels arbitrary: the existing kitchen was fine for 30 years, but now it needs GFCI outlets on every counter, a dedicated circuit for the microwave, and a vented range hood where there wasn’t one before. The cost of bringing the existing work up to current code during a renovation is a very common overrun source, and it’s difficult to predict without a thorough pre-planning inspection.
3. Scope creep and upgrade decisions (20–30% of overrun dollars)
This is the human factor. The project is underway. The room looks good. The contractor says, “While we’re at it, you might as well upgrade the flooring while the subfloor is exposed.” You’re mid-project, you’re excited about the transformation, and your willingness to spend rises. The contractor sees an opportunity. Both of you walk away feeling reasonable.
It compounds as the project progresses: the early additions are small, and the ones made once the site is open and the trades are waiting are not. The decision fatigue I describe in the kitchen timeline post doesn’t just make you tired — it makes you spendier.
Which rooms overrun the most
Not all renovations are created equal. The data consistently shows this hierarchy of overrun risk:
| Room / Scope | Typical overrun | Why |
|---|---|---|
| Kitchen (full gut) | 20–35% | Highest cost, most hidden systems, highest scope creep |
| Bathroom (full gut) | 18–30% | Hidden plumbing, waterproofing, structural issues |
| Multi-room (kitchen + bath) | 25–40% | Compounding unknowns, extended timeline = more labor cost |
| Basement finish | 15–25% | Moisture, egress, electrical, and structural surprises |
| Whole-house cosmetic | 10–20% | No hidden systems, but large surface area compounds paint/flooring variances |
| Single-room cosmetic | 5–15% | Lowest risk; most predictable scope |
The takeaway: the more rooms you touch, the more unknowns you compound. A full-kitchen gut renovation is already a high-risk project. Adding a bathroom to it doesn’t just add costs — it multiplies them because the two projects share trade schedules, project management overhead, and decision fatigue. The data supports the intuition: doing two high-risk rooms simultaneously is riskier than doing either one alone.
Age of home = correlation with overrun
Home age is one of the strongest predictors of cost overrun, and the curve is consistent:
| Home built | Average overrun | Typical contingency to target |
|---|---|---|
| Post-2000 | 8–12% | 10–15% |
| 1990–2000 | 12–18% | 15–20% |
| 1960–1989 | 18–25% | 20–25% |
| Pre-1960 | 25–35% | 25–30%+ |
The correlation is intuitive: older homes have more accumulated unknown history, more outdated systems, and more undocumented modifications. But the numbers matter more than the intuition. If you’re renovating a 60-year-old home and budgeting 10% contingency, you’re betting against a statistical distribution that puts the average overrun at 25%. That’s not optimism; it’s a bet on being an outlier in your own favour.
The timeline effect: overruns grow as projects extend
One of the most underappreciated data points in the renovation literature is the relationship between project duration and cost overrun. The longer a renovation takes, the higher the overrun — even if the scope is exactly as planned.
This happens because:
- Labor escalates. A project that takes 14 weeks instead of 10 has four extra weeks of carpenter hours, painter hours, and project management costs. If a carpenter charges $80/hour and works 30 hours a week, that’s $9,600 in extra labor alone.
- Material prices move. If your project starts in January and finishes in July, the price of lumber, fixtures, and appliances may have shifted. Most quotes are valid for 30–60 days.
- The “while we’re at it” compound effect. Each additional week in a partially-demolished kitchen gives you more opportunities to make additional decisions. The longer you’re in the project, the more these decisions accumulate.
The Construction Industry Institute found that projects lasting 25% longer than estimated had 8–12 percentage points higher cost overruns. Duration and cost overrun are not just correlated — they’re causally linked through the mechanisms above.
Why the 10% rule doesn’t work for renovations
The 10% contingency figure is standard in many contractor quotes and is widely repeated in online advice. It comes from new construction, where the building envelope is new, the systems are new, and the only unknowns are supply chain delays and minor design changes.
But a renovation is the opposite of new construction. You are disturbing an existing, aging structure with potentially decades of undocumented modifications, outdated wiring and plumbing, accumulated moisture damage, and structural wear. The Construction Industry Institute’s data puts the average overrun for renovation at 20–25%, roughly double the new-construction baseline.
The 10% rule fails for renovations not because contractors are lying. It fails because it’s borrowed from the wrong data set.
How to use these numbers in your own budget
The statistics above aren’t predictions for your specific project — they’re distributions. Your project might land at 8% or 35%. But distributions tell you how to size your risk:
-
Size your contingency to your home’s age and scope. Use the table in the “Age of home” section above as your starting point. Post-2000, cosmetic-only? 10% is defensible. Pre-1960, full-kitchen gut? 25%.
-
Set a personal hard cap. Decide in advance what maximum overrun you can absorb without refinancing or selling. That number becomes your budget, not the contractor’s quote. If the quote plus contingency exceeds your hard cap, either reduce scope or increase the timeline so you can fund it in stages.
-
Log every overrun in real time. The difference between surprise and managed overrun is almost always timing. If you discover a $3,000 issue in week one, you can cut scope. If you discover it in week eight, you can’t. Log costs as they happen and watch your running contingency balance in real time, so you always know exactly where you stand.
-
Invest in diagnostics before demolition. A structural engineer’s report, a thermal imaging scan for moisture, or even a small exploratory opening in a wall can reduce the “hidden damage” category from a surprise to a known cost. This is the single most effective pre-project investment for reducing overruns on older homes.
Putting it in context
The numbers above might feel alarming. They should. Renovation cost overruns are not a sign of bad planning — they’re a structural feature of building work in existing structures. The goal isn’t to avoid overruns entirely (that’s statistically unrealistic). The goal is to size your contingency to the evidence, track every overrun as it happens, and make deliberate scope adjustments early.
The renovation contingency budget guide walks through exactly how to size and protect your buffer. The kitchen renovation timeline shows you where the risks live week by week. Both are essential reading before you sign a quote.
Related posts
- Renovation Budget Template (Free PDF + Google Sheet)
- How to Budget a Home Renovation Without Going Over
- Renovation Contingency Budget: How Much to Set Aside
- A Realistic Kitchen Renovation Timeline (Week-by-Week)
Ready to track your renovation from day one?
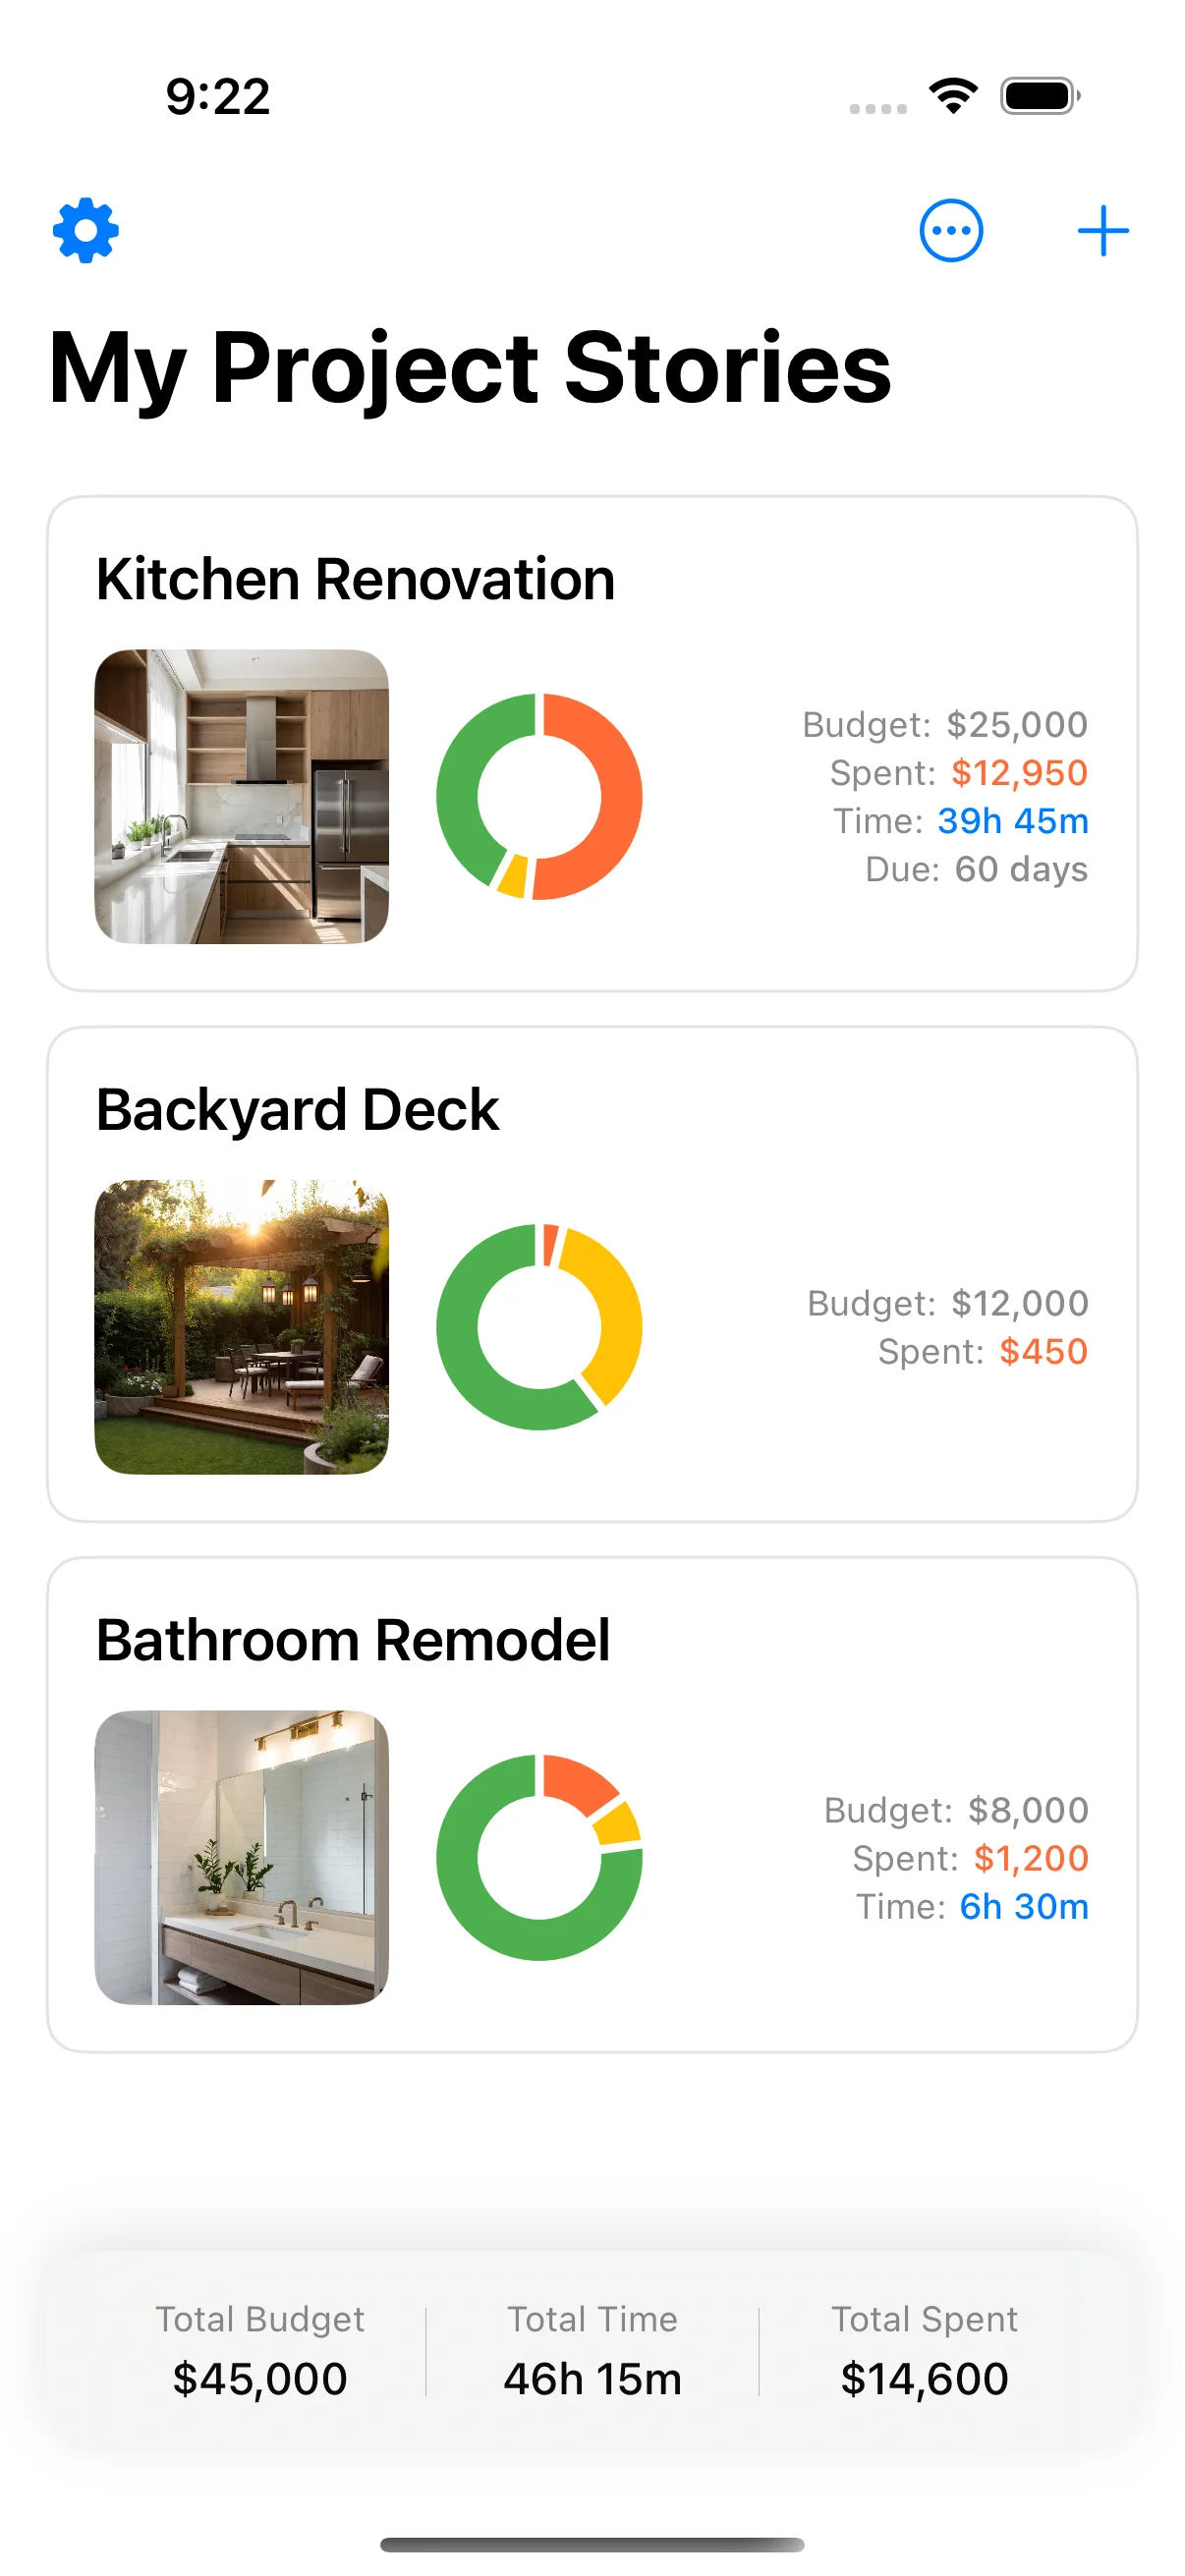
The statistics in this post tell you what can happen. Home Stories shows you what is happening — every overrun logged in real time, your remaining contingency balance visible at a glance, and a running budget that tells you whether you’re on track every single day. Set it up before the first wall comes down so your baseline numbers are already there.
Sources and further reading
The ranges and guidance above are drawn from direct project experience and from the bodies below, which publish the underlying standards, rules and market data. They are worth reading directly before you commit money.
- Houzz & Home study — renovation spend and scope data — Houzz
- Housing economics and remodeling market data — National Association of Home Builders
- Home improvements and repairs — US Dept. of Housing and Urban Development
Frequently asked questions
What is the average cost overrun for a home renovation?
Across published remodeling market data and contractor reporting, the average renovation cost overrun sits between 15% and 30%. Projects that involve structural changes or opening up walls cluster nearer the top of that band, around 25%. Projects limited to cosmetic upgrades and surface work tend toward 10–15%. The key pattern is that the more you disturb the existing building envelope, the higher the overrun — and that's not bad project management, it's simply how much is hidden behind the walls that nobody can see until the work starts.
Which room has the biggest cost overrun?
Kitchens and bathrooms consistently have the highest cost overruns, and for the same reason: they combine the highest dollar value of work with the highest density of hidden infrastructure. Every kitchen and bathroom renovation involves plumbing, electrical, and often structural changes behind walls — the three categories most likely to conceal surprises. Kitchens tend to overrun by a wider margin than other rooms, partly because the fixture and finish costs are also where scope creep is most active (upgrading the countertop, the appliances, the cabinetry).
Does an older home have a higher cost overrun?
Yes, significantly. Multiple datasets show that pre-1990 homes have average overruns 8–12 percentage points higher than post-2000 builds. The reasons are straightforward: older wiring and plumbing are more likely to be non-compliant with current codes, the foundation and structural members may have accumulated decades of wear, and earlier building practices frequently left gaps (unpermitted work, undocumented modifications) that only surface during demolition. If you're renovating a 50+ year old home, budgeting 25% contingency is statistically defensible. 10% is a lottery.
What causes the most cost overruns in renovations?
The single largest cost driver across datasets is hidden structural damage discovered during demolition — this includes rot in structural timbers, water damage hidden behind finishes, non-compliant or deteriorated wiring and plumbing, and foundation or floor-leveling issues. Secondary drivers include unforeseen code requirements (the inspector mandates upgrades the original quote didn't include), supply chain delays that extend the project timeline and increase labor costs, and scope creep (the "while we're at it" decisions that happen once the project is underway and the original boundaries feel less rigid). In practice structural surprises account for the largest share of overrun spending, with code-driven upgrades second and scope creep making up the rest — which is why contingency should be sized against how much of the building you are opening up, not against the headline project value.
How can you reduce renovation cost overruns?
You can't eliminate them — surprises are structural to any renovation that opens walls. But there is a clear hierarchy of reduction. First, invest in a thorough pre-purchase inspection and, if budget allows, a diagnostic opening (a small exploratory cut into a wall or ceiling to look behind before committing to a quote). Second, set your contingency at the higher end for the project type (25% for older homes, 15–20% for post-1990 with wall work, 10% for surface-only cosmetic work). Third, lock in your fixture and finish selections before demolition starts — scope creep during the project is the most controllable variable. Fourth, log every cost in real time and watch the contingency trend. Home Stories does this automatically, so you see your remaining buffer update the moment a surprise cost hits, giving you time to adjust scope early rather than discovering the overbudget situation at the worst possible moment. [Home Stories is free on the App Store](https://apps.apple.com/app/id6754754960).
Keep reading

How to Budget a Home Renovation: 7 Steps to an Honest Budget
How to budget a home renovation — 7 steps to build an honest budget that covers scope, contingency, and every hidden cost.
Renovation Contingency Budget: How Much to Set Aside and Why
Renovation contingency budget — why you need 15-20% extra, where surprises come from, and how to track your contingency.

Renovation Spreadsheet Alternative: Why Apps Beat Spreadsheets
Renovation spreadsheet alternative — why apps beat spreadsheets for tracking renovation costs, receipts, and decisions on-site.